Section 2.4 Survey Problems
Objectives
Solve survey problems with Venn diagrams.
Sometimes we may be interested in the cardinality of the union or intersection of sets, but not know the actual elements of each set. This is common in surveying.
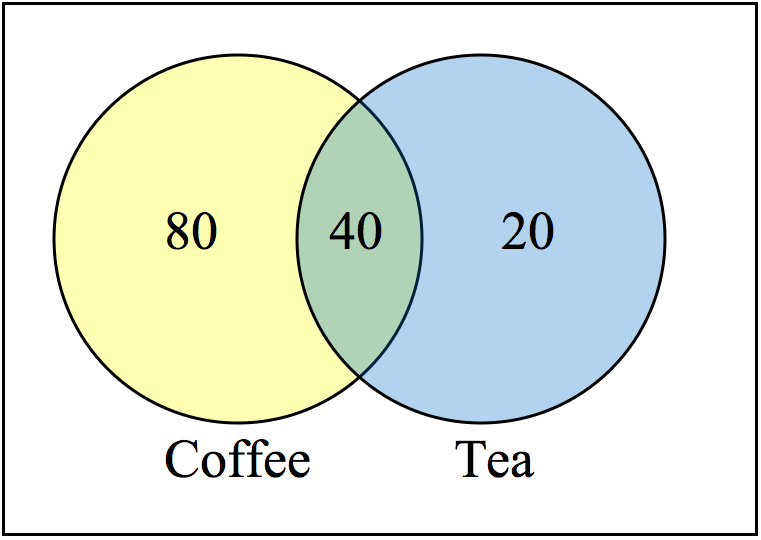
Example 2.4.1.
A survey asks 200 people “What beverage do you drink in the morning”, and offers choices:
Tea only
Coffee only
Both coffee and tea
Suppose 20 report tea only, 80 report coffee only, 40 report both. How many people drink tea in the morning? How many people drink neither tea or coffee?
Solution.This question can most easily be answered by creating a Venn diagram. We can see that we can find the people who drink tea by adding those who drink only tea to those who drink both: 60 people.
We can also see that those who drink neither are those not contained in the any of the three other groupings, so we can count those by subtracting from the cardinality of the universal set, 200.
\(200 - 20 - 80 - 40 = 60\) people who drink neither.
Example 2.4.2.
A survey asks: Which online services have you used in the last month:
Twitter
Facebook
Have used both
The results show 40% of those surveyed have used Twitter, 70% have used Facebook, and 20% have used both. How many people have used neither Twitter or Facebook?
Solution.Let T be the set of all people who have used Twitter, and F be the set of all people who have used Facebook. Notice that while the cardinality of F is 70% and the cardinality of T is 40%, the cardinality of \(F \cup T\) is not simply 70% + 40%, since that would count those who use both services twice. To find the cardinality of \(F \cup T\text{,}\) we can add the cardinality of F and the cardinality of T, then subtract those in intersection that we’ve counted twice. In symbols,
\(n\left(F \cup T\right) = n\left(F\right) + n\left(T\right) - n\left(F \cap T\right)\)
\(n\left(F \cup T\right) = 70\% + 40\% - 20\% = 90\%\)
Now, to find how many people have not used either service, we’re looking for the cardinality of \(\left(F \cup T\right)^C\)
Since the universal set contains 100% of people and the cardinality of \(F \cup T = 90\%\text{,}\) the cardinality of \(\left(F \cup T\right)^C\) must be the other 10%.
The previous example illustrated two important properties
Note 2.4.3.
Cardinality Properties
\(n\left(A \cup B\right) = n\left(A\right) + n\left(B\right) - n\left(A \cap B\right)\)
\(n\left(A^C\right) = n\left(U\right) - n\left(A\right)\)
Notice that the first property can also be written in an equivalent form by solving for the cardinality of the intersection:
\(n\left(A \cap B\right) = n\left(A\right) + n\left(B\right) - n\left(A \cup B\right)\)
Example 2.4.4.
Fifty students were surveyed, and asked if they were taking a social science (SS), humanities (HM) or a natural science (NS) course the next quarter.
21 were taking a SS course
26 were taking a HM course
19 were taking a NS course
9 were taking SS and HM
7 were taking SS and NS
10 were taking HM and NS
3 were taking all three
7 were taking none
How many students are only taking a SS course?
Solution.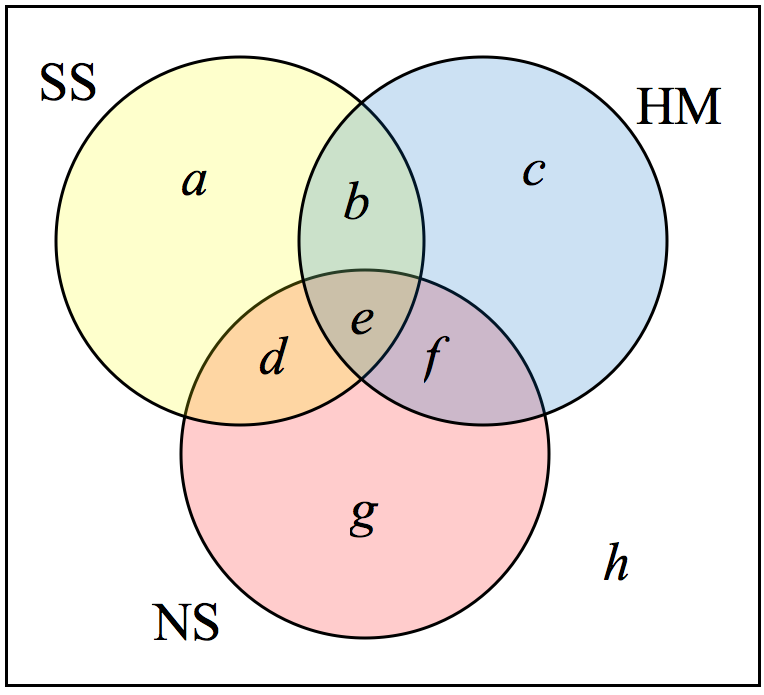
It might help to look at a Venn diagram. From the given data, we know that there are 3 students in region e and 7 students in region h.
Since 7 students were taking a SS and NS course, we know that n(d) + n(e) = 7. Since we know there are 3 students in region 3, there must be 7 - 3 = 4 students in region d.
Similarly, since there are 10 students taking HM and NS, which includes regions e and f, there must be 10 - 3 = 7 students in region f.
Since 9 students were taking SS and HM, there must be 9 - 3 = 6 students in region b.
Now, we know that 21 students were taking a SS course. This includes students from regions a, b, d, and e. Since we know the number of students in all but region a, we can determine that 21 - 6 - 4 - 3 = 8 students are in region a.
8 students are taking only a SS course.
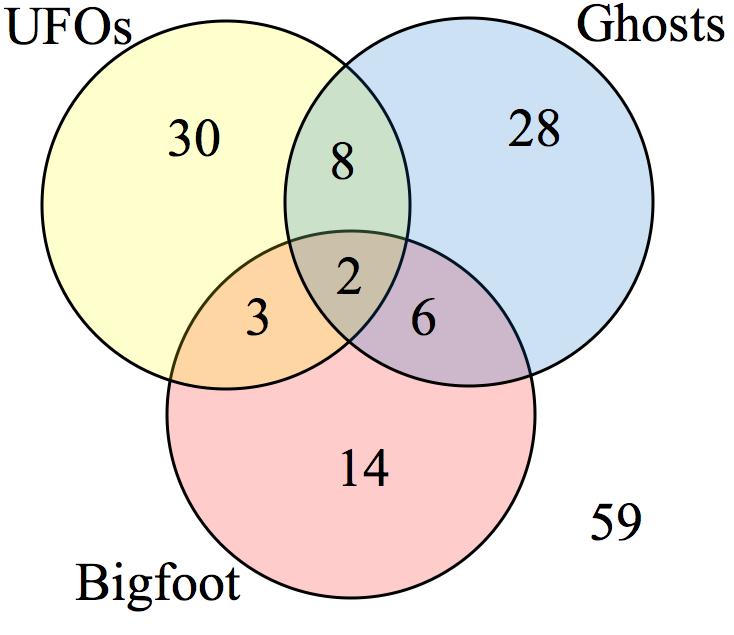
Problem 2.4.5. Try It Now.
One hundred fifty people were surveyed and asked if they believed in UFOs, ghosts, and Bigfoot.
43 believed in UFOs
44 believed in ghosts
25 believed in Bigfoot
10 believed in UFOs and ghosts
8 believed in ghosts and Bigfoot
5 believed in UFOs and Bigfoot
2 believed in all three
How many people surveyed believed in none of these things?
Answer.Starting with the intersection of all three circles, we work our way out. Since 10 people believe in UFOs and Ghosts, and 2 believe in all three, that leaves 8 that believe in only UFOs and Ghosts. We work our way out, filling in all the regions. Once we have, we can add up all those regions, getting 91 people in the union of all three sets. This leaves \(150 - 91 = 59\) who believe in none.
Example 2.4.6.
A streaming service surveyed the viewing preferences of 50 users. The following information was obtained:
10 want to watch movies, TV shows, and documentaries
16 want to watch movies and documentaries
11 only want to see movies
16 want to see movies but not documentaries
14 want to see TV shows and documentaries
27 want to see TV shows
40 want to see movies or documentaries
Create a Venn diagram to descrive this data. Then determine the number of people who are only interested in watching documentaries.
Solution.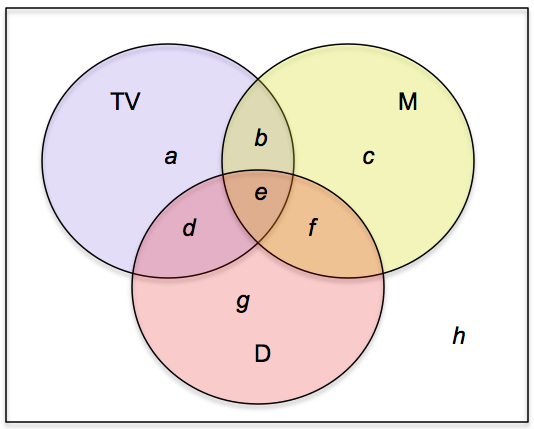
We can start by putting 10 in region e, since 10 people are interested in all three.
Since 16 people want to see movies and documentaries, regions e and f must add up to 16. 16 - 10 = 6, so there are 6 people in region f.
11 people only want to see movies, so region c must be 11.
16 want to see movies, but not documentaries. This would include the part of circle M that is not overlapping with circle D. Regions b and c must add up to 16. There are 11 people in region c, so b = 16 - 11 = 5.
14 want to see TV shows and documentaries. Regions d and e add up to 14, so d = 14 - 10 = 4.
27 want to see TV shows. Everything in the TV circle must add up to 27--that includes regions a, b, d, and e. Region a = 27 - 5 - 10 - 4 = 8.
40 want to see either movies or documentaries. \(n\left(M \cup D\right)=40\text{,}\) so the regions in sets M or D must add up to 40. We already know regions b, c, d, e, and f. Those add up to \(5+11+4+10+6=36\text{,}\) so there must be 4 people in region g.
Finally, the sum of all the people inside the sets is 48. Since 50 people were surveyed there are 2 people in region h.
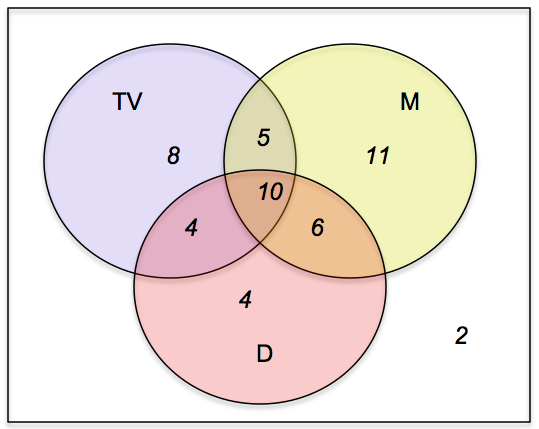
The number of people only interested in watch documentaries would be those in region g. There are 4 people only interested in documentaries.